Work Trends | Chapter 4
Unfulfilled Expectations: Student Debt, Recent College and High School Graduates
Three studies conducted in 2011 and 2012 explored the experiences of high school and college graduates from the classes of 2006 to 2011. The purpose of the studies was to understand how recent graduates were faring in the workforce, specifically looking at those individuals who graduated before and during the difficult labor market caused by the Great Recession.

Studies
Unfulfilled Expectations
A nationally representative survey conducted March 15 to April 5, 2011 of 571 U.S. residents who graduated from a four-year postsecondary institution between 2006 and 2010.
Chasing the American Dream
A nationally representative survey conducted March 21 to April 2, 2012 of 444 U.S. residents who graduated from a four-year postsecondary institution between 2006 and 2011, including 315 reinterviews of 2006 to 2010 graduates from the Heldrich Center’s 2011 study and 129 new interviews of 2011 graduates.
Left Out. Forgotten?
A nationally representative survey conducted March 21 to April 2, 2012 of 544 U.S. residents who graduated from a secondary institution between 2006 and 2011.
Media Coverage
College Graduate Themes
College Debt
In 2011, recent college graduates reported a median debt of $20,000. Graduates of public institutions carried 25% less debt than private-school graduates – $18,680 vs. $24,460.
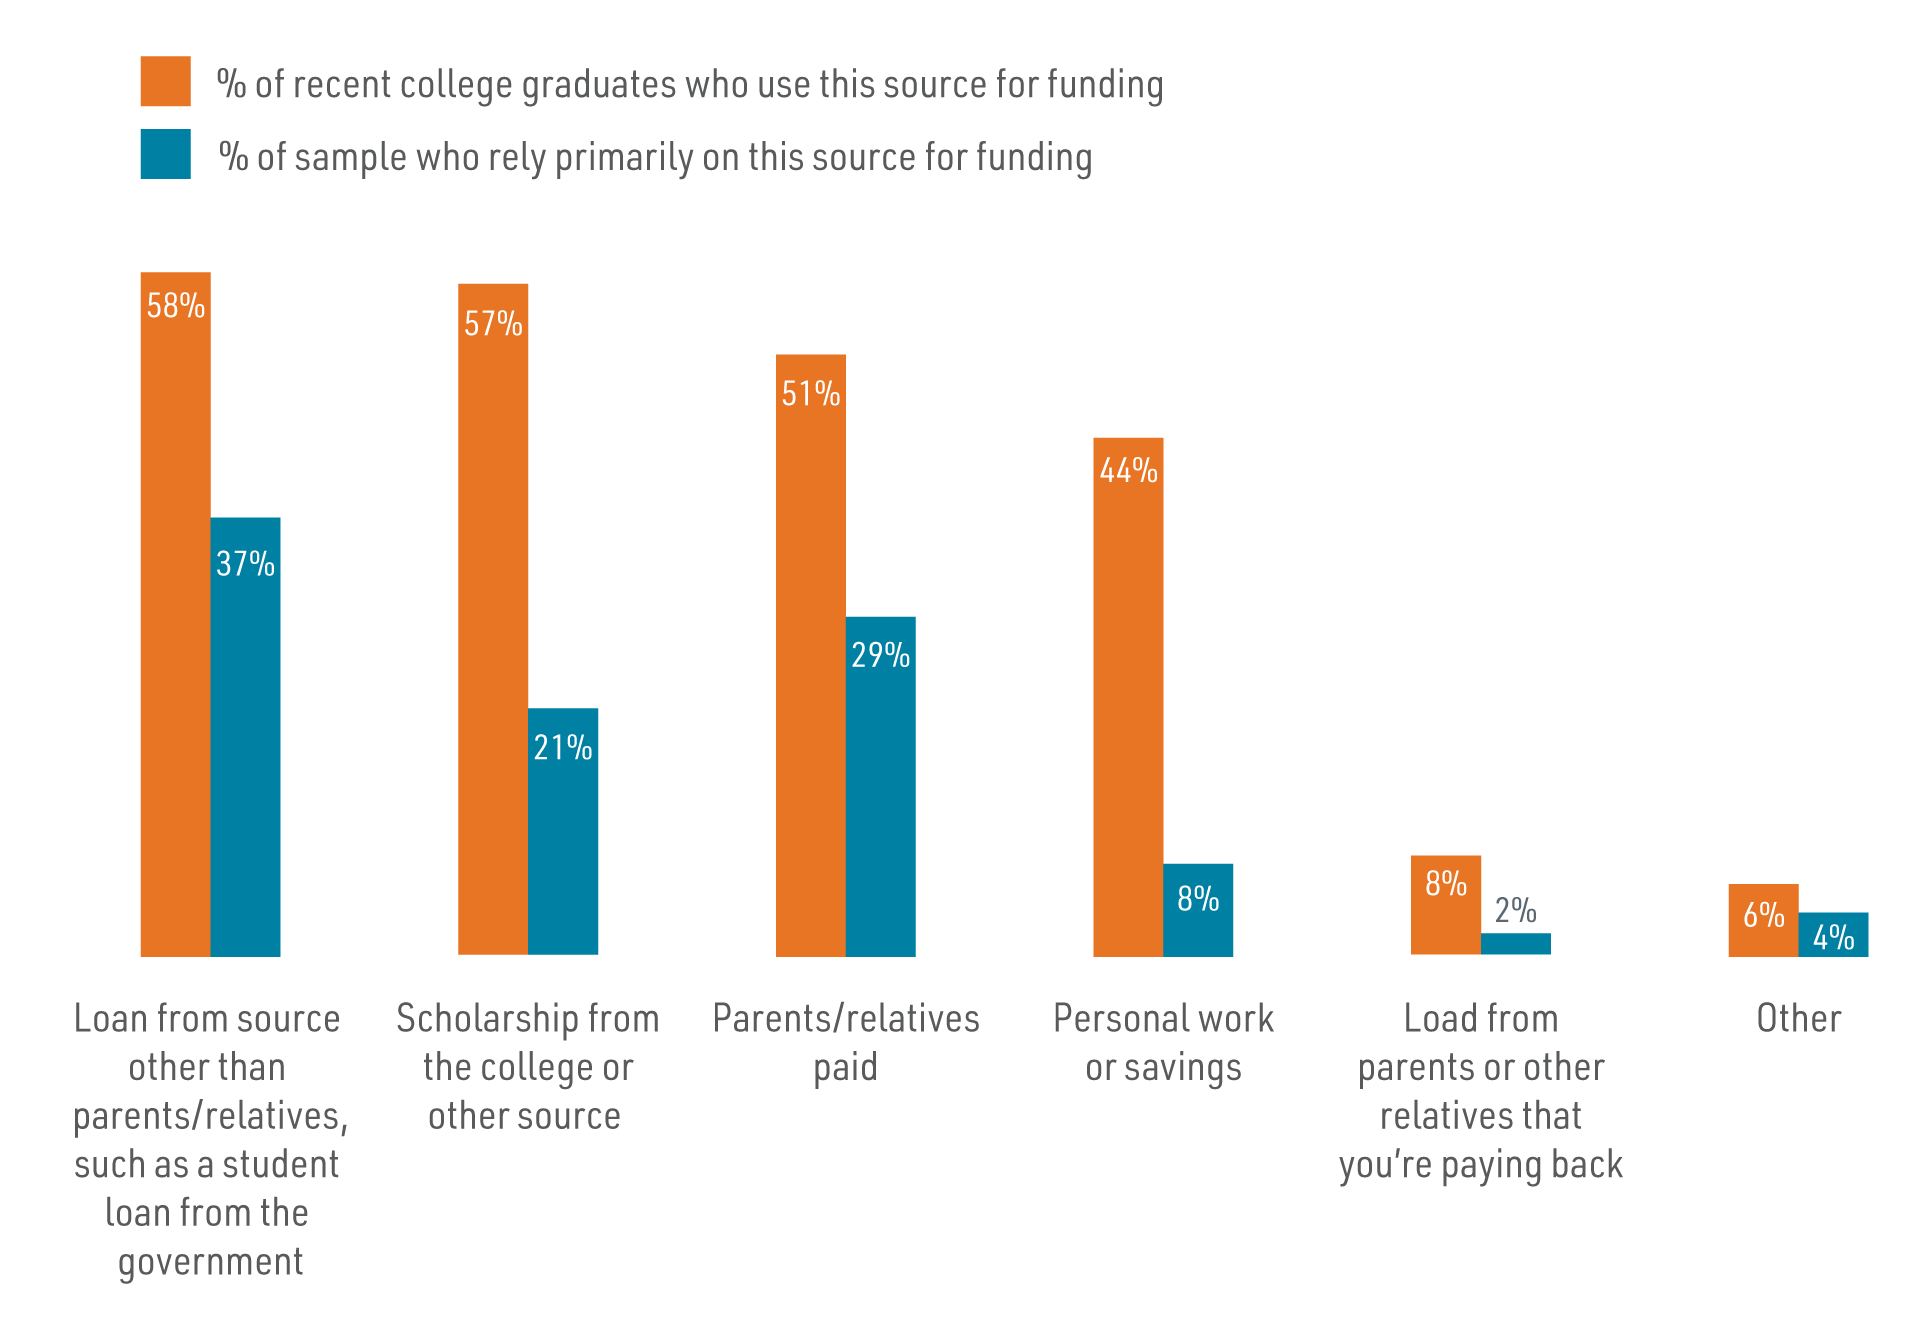
Two thirds of graduates used at least two different funding sources — 6 in 10 borrowed money from a source such as the federal government (58%). Four in 10 said this was their primary source of money to pay for college (37%). Four fifths reported working at least part time while in college, with nearly one quarter (23%) working full time. Five in 10 had parents or relatives pay (51%).
Six in 10 owed money to pay off their student loans upon graduation. At the time of the survey, a majority of students (83%) owed at least half of what they borrowed.
First Jobs and Pathways to Next Jobs and Careers
In 2011, 82% were working in some way at the time of the survey. Fifty-three percent (53%) had full-time jobs and were not in school, and 21% were attending graduate school on either a full- or part-time basis. Fourteen percent (14%) were looking for a full-time job.
In 2012, 51% were employed full time at the time of the survey, 6% were working part time and looking for full-time work, 6% were working part time and not looking, 6% were unemployed and looking, 6% were attending graduate/professional school and not employed, and 14% were attending graduate or professional school and employed full time or part time.
The accompanying table shows median starting salary for the 2011 sample of college graduates, disaggregated by graduation year, type of institution attended, whether an internship was completed, perceptions of degree and job alignment, and wage type.
Recent College Graduates’ Median Starting Salary for First Job, by Various Characteristics
| Recent College Graduates (2011) | Median Starting Salary for First Job |
| All graduates | $30,000 |
| Pre-recession (2006 to 2007) | $30,000 |
| Recession (2009 to 2011) | $27,000 |
| Public school | $30,000 |
| Private school | $30,000 |
| Did internship | $34,680 |
| No internship | $28,000 |
| First job very/somewhat related to degree | $35,000 |
| First job not very/not at all related to degree | $25,000 |
| Salary | $35,510 |
| Hourly | $25,000 |
Voices of Graduates
Why do you think you have not found a full-time job? (2012)
You mentioned that your college education prepared you well to be successful in your first full-time job. Please briefly explain how you were well prepared.
College Decision-Making
In 2011, three quarters of the sample would have done something different to be successful in the labor market/workplace.
%
were more careful about selecting a major/chose a different major
%
did more internships or worked part time
%
would have started looking for work much sooner while still in college
High School Graduate Themes
Where did they go?
Thirty percent (30%) indicated they were unemployed and looking for work, 45% were looking for full-time work, nearly half were actively seeking employment for more than six months, and 3 in 10 were actively seeking employment for more than a year. Nearly half of all high school graduates were looking for full-time employment at the time of the survey.

By the Numbers
After graduation did you…
%
Find or look for a job
%
Go to a community college full time
%
Go to a four-year college/ university full time
%
Take college courses part time
%
Take some time off for family or health reasons
%
Other
%
Join the military
%
Enter a job training program
By the Numbers
%
worked in temporary positions in their first jobs; over half were part time
%
worked hourly; the median wage was $7.50 ($0.25 over the federal minimum wage)
%
indicated their first job was a job to get by
%
said their current job was to get by rather than a career or a stepping stone to a career
was the median salary for their current job, a modest increase from $7.50 for their first job
College Plans
Most high school graduates said they would need more education to have a successful career, yet few planned to attend: 38% definitely planned to attend college, with another 25% saying they “probably will.” Among the 17% saying they definitely or probably will not go (back) to college, just 22% said they either had enough college or did not need any more college for what they want to do. The primary barriers were economic, with 34% saying they could not afford college and 37% saying they needed to work to make ends meet.
%
of high school graduates said they will need more education to be successful in the career they want
%

